tl;dr
Between 2015 and 2024, the number of employees appearing on Ontario’s Sunshine List grew sharply, especially within the same five sectors year after year. School Boards, Municipalities & Services, Hospitals, Universities, and Ontario Government Ministries consistently made up the top five, with School Boards seeing the most dramatic growth after 2020.
Intro
If you’ve ever scanned the Sunshine List and felt like it just keeps getting longer, you’re not imagining things. Looking at the data from 2015 through 2024, the number of employees earning over the Sunshine List threshold has steadily increased, and it’s been driven by the same five public sectors almost every year.
This post focuses on the trend in the number of employees on the Sunshine List across the top five sectors. We’re not looking at individual salaries here, just how many people show up. And once you zoom out, some clear patterns start to emerge.
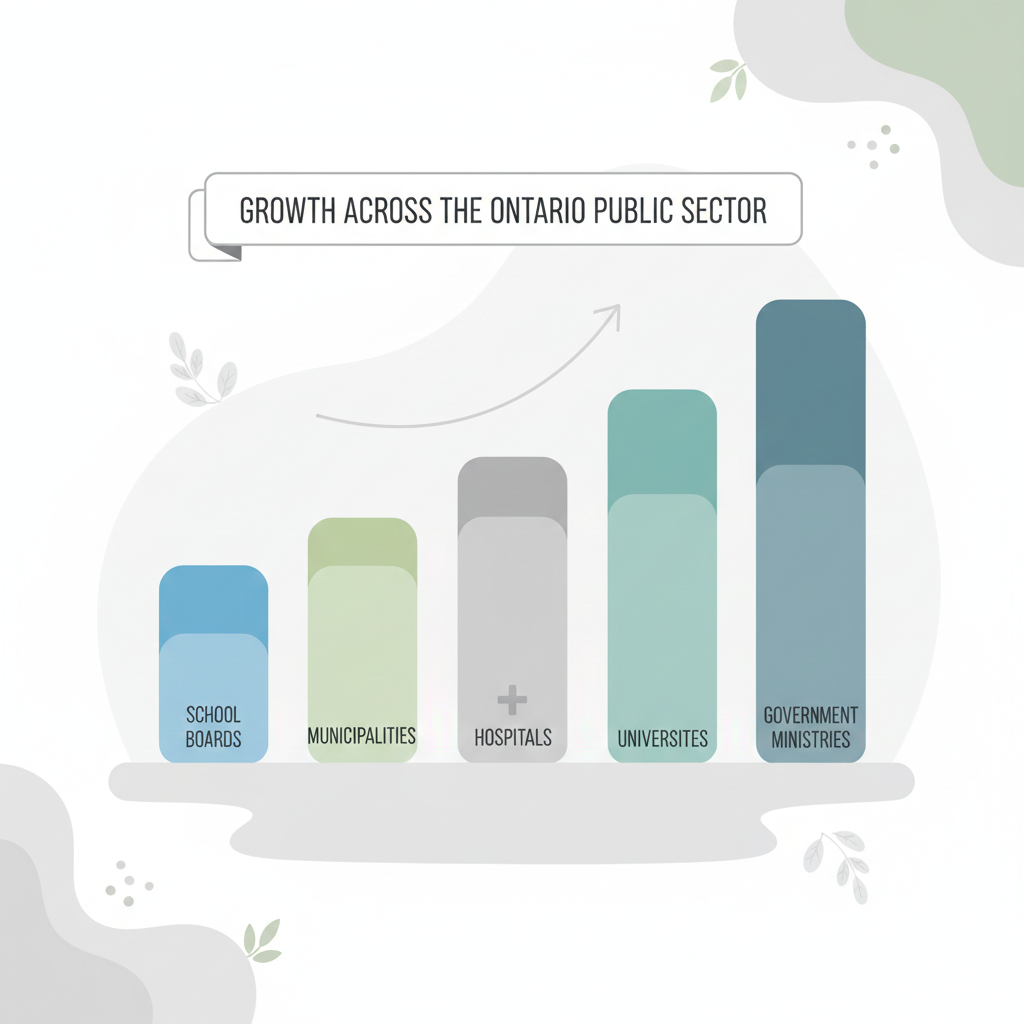
The five sectors that dominate the Sunshine List
Across the entire period, the same sectors appear again and again at the top:
- School Boards
- Municipalities & Services
- Hospitals & Boards of Public Health
- Universities
- Government of Ontario Ministries
Together, these five sectors account for the majority of Sunshine List disclosures every year. While other sectors fluctuate, these groups form the backbone of the list.
School Boards moved from large to massive
School Boards are the clearest example of long-term growth.
In 2015, about 15,300 school board employees appeared on the Sunshine List. By 2019, that number had climbed to roughly 28,200. Then came 2020 and the acceleration really kicked in.
By 2021, School Boards jumped to more than 80,000 disclosures. After a brief plateau in 2022 and 2023, 2024 saw another surge, reaching approximately 118,000 employees.
That means the number of school board employees on the Sunshine List is now more than seven times higher than it was less than a decade earlier.
This doesn’t necessarily mean salaries exploded overnight. Instead, it reflects a threshold that hasn’t kept up with inflation, combined with a very large workforce that includes experienced teachers, administrators, and specialists.
Municipalities & Services grew steadily every year
Municipalities & Services show a slower but very consistent climb.
In 2015, municipalities accounted for about 34,400 Sunshine List disclosures. Every year after that brought an increase. By 2020, the total passed 52,000. By 2024, it reached roughly 76,500.
What’s notable here is the lack of dips. Even during years when other sectors stalled or flattened, municipalities continued upward.
This steady growth reflects how broad municipal work really is. It includes police, fire services, transit, utilities, and senior administrative roles. Many of these positions have structured pay grids that naturally rise over time.
Hospitals saw pandemic-era acceleration
Hospitals and Boards of Public Health followed a different path.
From 2015 to 2019, growth was gradual, moving from about 13,100 disclosures to just over 21,300. Then 2020 changed everything.
By 2020, hospital disclosures jumped to nearly 34,000. In 2022, they exceeded 40,000. And by 2024, hospitals reached roughly 67,500 Sunshine List employees.
That’s more than a fivefold increase since 2015.
Some of this reflects pandemic-related pressures, overtime, staffing shortages, and retention adjustments. But again, the static Sunshine List threshold plays a big role in why so many healthcare professionals now appear.
Universities kept climbing at a slower pace
Universities also show steady growth, though less dramatic than schools or hospitals.
In 2015, universities had about 17,100 disclosures. By 2019, that rose to around 20,700. Growth continued through the early 2020s, reaching approximately 26,200 in 2023 and about 29,200 in 2024.
Universities employ a mix of faculty, senior administrators, researchers, and technical specialists. Many roles are tied to tenure, long service, or specialized expertise, which naturally pushes salaries upward over time.
Ontario Government Ministries expanded quietly
Ontario Government Ministries round out the top five.
In 2015, ministries reported roughly 12,600 Sunshine List disclosures. By 2019, that number was close to 17,700. Growth continued after 2020, reaching about 23,100 in 2023 and more than 31,500 in 2024.
While the total numbers are smaller than schools or municipalities, the growth rate is still significant. Ministries employ a wide range of policy, regulatory, legal, and executive staff, many of whom have long career paths within government.
Why the same five sectors keep showing up
It’s tempting to assume these trends are all about pay increases. In reality, there’s more going on.
First, the Sunshine List threshold has remained fixed at $100,000 since the mid-1990s. Adjusted for inflation, that figure would be far higher today.
Second, these five sectors employ very large workforces. Even modest annual increases push thousands of employees over the line.
Third, many roles in these sectors are governed by collective agreements or structured salary bands. Over time, people move up those grids.
If you want to explore how this plays out across different public employers, you can browse more Sunshine List analysis on https://publicpaypulse.com/public-sector-insights/.
Also check out our interactive chart.
What this trend means going forward
If nothing changes, these numbers will likely keep rising.
As long as the Sunshine List threshold stays frozen, more mid-career public sector employees will appear each year. The list will continue to be dominated by School Boards, Municipalities, Hospitals, Universities, and Government Ministries.
Understanding these trends helps put the list into context. It’s less about sudden pay spikes and more about long-term structural forces that have been building quietly for years.